I render Solr heatmap data over base maps. So far, I haven’t made nice looking heatmap map layers without using a classification algorithm. Typically, the desired heatmap (perhaps based on Brewer colors) has 7 colors. So the document counts from Solr are through Jenks to create 7 categories. A color gradient is created with color stops where the Jenks based categories align with the colors from the color map. As discussed in a previous post, performance is important.
Jack Reed asked me a great question: is classification based on ckmeans a better option than Jenks? I hadn’t heard of ckmeans, but there’s a really nice JavaScript library that implements it. A brief investigation suggests it isn’t an improvement over Jenks. ckmeans from simple_statistics.js produces nearly the same classifications as Jenks from geostats.js. Based on Chrome’s timing feature, Jenks runs slightly faster.
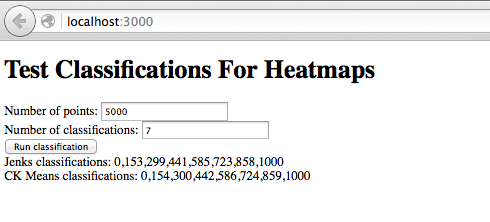
I ran ckmeans and Jenks in two different ways. The first used collections of random numbers generated in a small Angular 2 based site. The site allowed the user to enter the desired number of points and the desired number of classifications. Math.random created integers between 0 and 1000. Using this TypeScript code and 5000 points, Jenks classifications required 1.45 seconds while ckmeans required 1.9 seconds. The classifications generated by the two algorithms were nearly identical:
Jenks classifications: 0,149,299,435,572,708,853,999
CK Means classifications: 0,151,301,441,574,713,856
While this test was useful, one could argue classifying randomly generated numbers wasn’t a good test case. Ideally, heatmap numbers from a Solr response should be used. So, I tried that too. Again, Jenks ran more quickly. For roughly 10000 points, the time was 3.9 seconds for Jenks versus 6.3 for ckmeans. For roughly 5000 points, 1.06 versus 1.74. Again, the classifications were very similar:
jenks [0, 39, 161, 361, 686, 1000, 1266, 1801]
ckmeans [0, 33, 152, 354, 574, 812, 1136, 1453]
I don’t claim my testing was exhaustive. I tried two different ways and they agreed. Then, I returned to billable work. If you have other suggestions or ideas, just let me know. I’m happy to explore ideas to make the heatmaps work better and faster.
I’ll close with some less useful details. I liked the tutorials on the Angular 2 site. Nic Raboy had a great post on calling Javascript libraries from TypeScript. Here’s a screenshot of my Angular 2 app:
 And here’s the Angular 2/TypeScript code that responds to the button click:
// the event handler for the “compute” button
onSelect() {
let data = AppComponent.makeArray(this.numberOfPoints);
let g = new geostats(data);
let jenksClassifications = g.getClassJenks(this.numberOfClassifications);
// jenks returns lower bounds of each classification
this.jenks = jenksClassifications.toString();
let ckmeansClassifications = ss.ckmeans(data, this.numberOfClassifications);
// ckmeans returns all data in sorted arrays of arrays
// get lower bounds of each classification by take first element of array
let ssClassifications = [];
for (var index = 0 ; index < ckmeansClassifications.length ; index++)
ssClassifications.push(ckmeansClassifications[index][0]);
this.ckmeans = ssClassifications.toString();
}
// utility function to return an array of random numbers
static makeArray(size)
{
let a = [];
for (var i = 0 ; i < size ; i++)
a.push(Math.round(Math.random() * 1000));
return a;
}
I really enjoyed playing around with Angular 2 and hope to do more in the future.